Week 2: Forecasting Fundamentals, the Economy #
Monday, September 16, 2024
49 Days until Presidential Election
Welcome back and thanks for following along my forecast of the 2024 US Presidential Election. Since my last post, Vice President Harris and President Trump faced off in a debate moderated by ABC’s Linsey Davis and David Muir. Both candidates were asked about abortion, immigration, foreign policy, and the economy. Only one question was directly asked about the economy, aimed at VP Harris. “When it comes to the economy, do you believe Americans are better off than they were four years ago?” The focus of this week’s post is to build and evaluate models that attempt to illustrate the relationship between incumbent success and measures of the economy.
A Quick Note on Methodology #
I deviate from class-provided data by using incumbent vote margin as the outcome variable instead of incumbent two-party-adjusted vote share. There are two main reasons for this. The first is that two-party-adjusted vote metrics do not account for votes for third-party candidates, overlooking potentially significant voter dissatisfaction with the incumbent and/or main challenger candidate. At the same time, the vote margin metric is resistant to the shocks that a potentially “successful” third-party candidate might have on vote share. The second is that vote margin provides us with more insight into the swing between the main candidate: how far ahead was the winner to the runner-up and how close was the election are questions for which the vote margin metric can provide insight.
I source relevant metrics of the economy from a lively discussion between Geoffrey Skelley and Mary Radcliffe on the FiveThirtyEight Politics Podcast Episode “Presidential Debates Do Matter”. I highly recommend listening to the episode here. Interestingly, Skelley notes that American voters tend to look to national metrics of the economy in deciding who to vote for more than personal metrics, a phenomenon known as sociotropic voting. I believe there is some truth to this, especially in the ways that changes in national economic performance can trickle down to affect personal finances. Radcliffe and Skelley put together four broad economic phemeona voters internalize as they vote:
inflation
unemployment
personal finances
stock market performance
Part of my contribution this week is interpreting these phenomena into specific metrics. I rely on the Consumer Price Index as a measure of inflation, the unemployment rate as a measure of unemployment, quarterly growth in Real Disposable Personal Income as a measure of personal finances, and percent change between SP500 Open and Close reports as a measure of stock market performance. Radcliffe argues that before COVID the price of goods and services and unemployment/jobs were the most salient economic issues to voters. Since shutdowns, though, unemployment has become a much bigger concern for voters.
GDP Growth and Vote Margin #
Let’s first look at a broad measure of economic performance and evaluate it against incumbent vote margin:
## Warning: The following aesthetics were dropped during statistical transformation: label.
## ℹ This can happen when ggplot fails to infer the correct grouping structure in
##   the data.
## ℹ Did you forget to specify a `group` aesthetic or to convert a numerical
##   variable into a factor?
## Warning: The following aesthetics were dropped during statistical transformation: label.
## ℹ This can happen when ggplot fails to infer the correct grouping structure in
##   the data.
## ℹ Did you forget to specify a `group` aesthetic or to convert a numerical
##   variable into a factor?
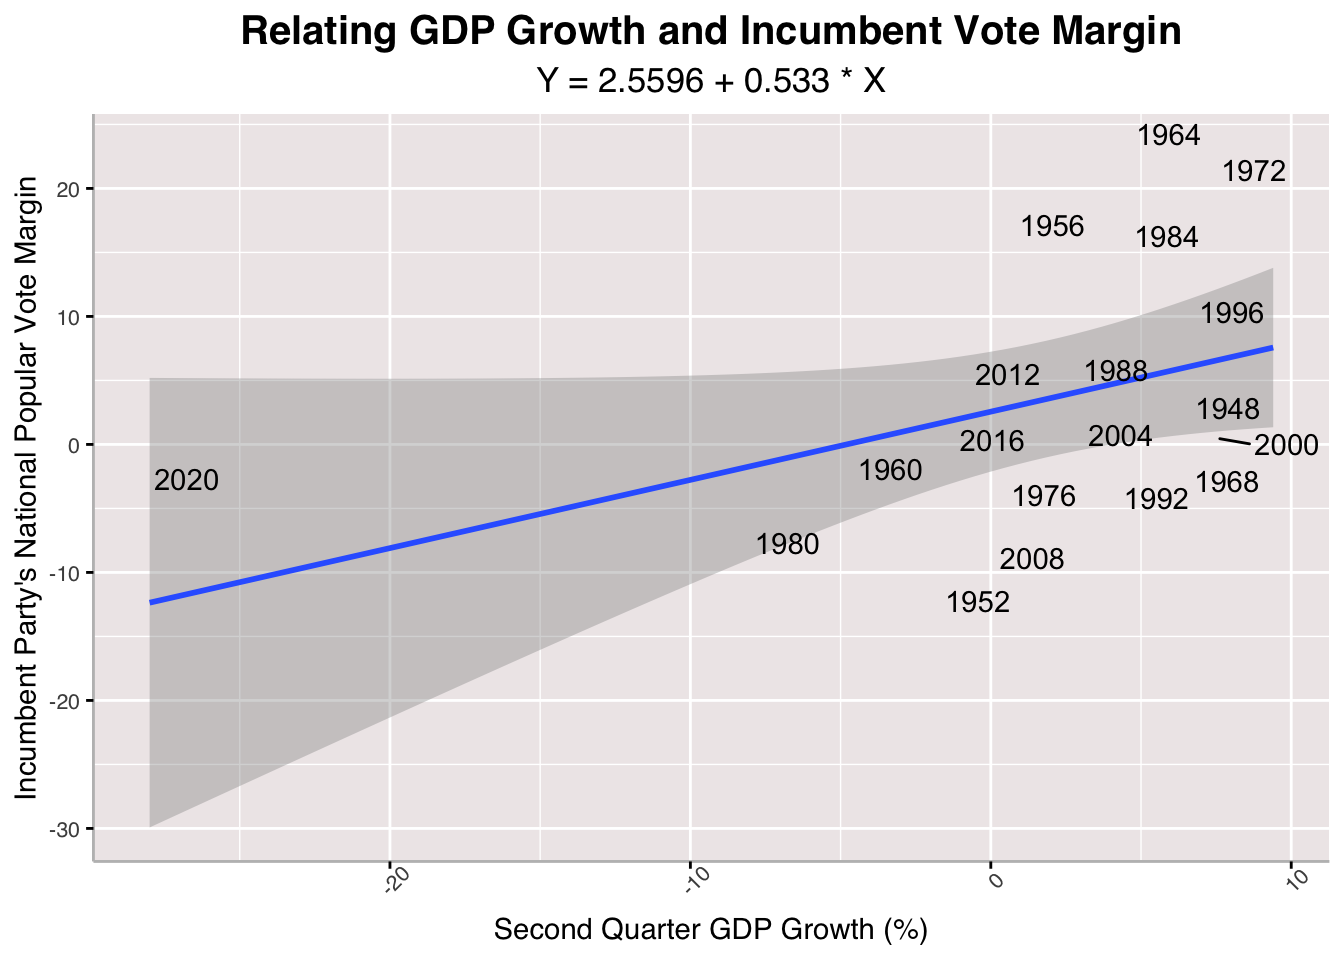
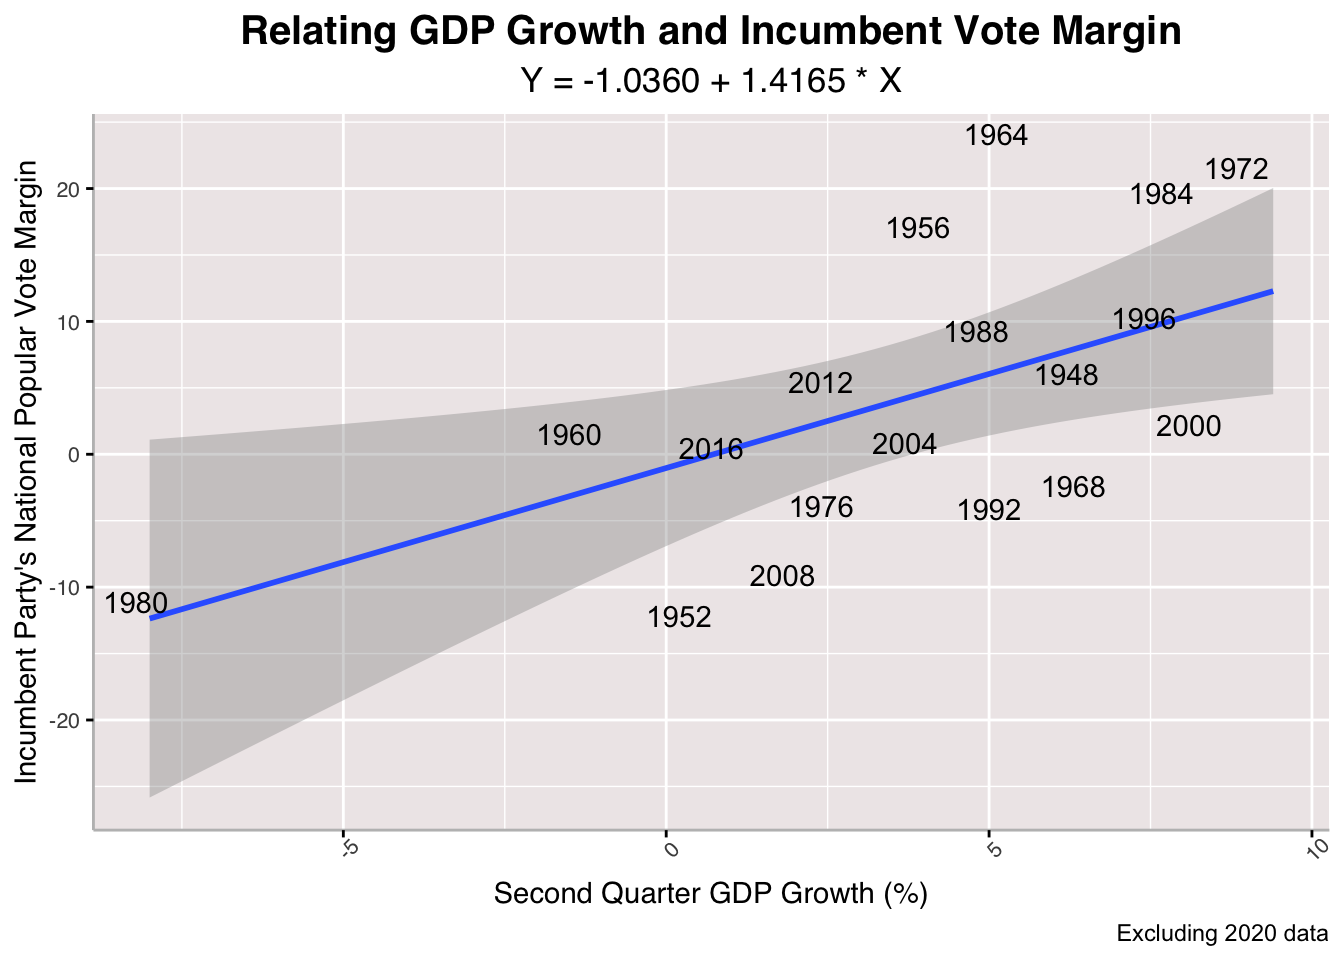 Here, I run a linear regression on the relationship between between Quarterly GDP Growth and Incumbent Vote Margin, mapping actual election results from 1948 to 2020 onto the plot as well. We observe a pretty strong positive relationship between GDP growth and incumbent vote margin, suggesting that the better the output of the national economy, the better an incumbent party's performance in the upcoming presidential election. You might notice that I have two plots: one with 2020 as a data point and one without. This is because across a number of metrics 2020 is a distant outlier, which often skews models in a ways that confuses any actual evaluation of a relationship between economy and election performance. I keep both plots to illustrate this discrepancy and to note which metrics 2020 data falls into a predicted pattern for and which it does not.
## [1] "With 2020 R-Squared: 0.187884044842374"
## [1] "Without 2020 R-Squared: 0.317291723250674"
## [1] "With 2020 Mean Squared Error: 79.2859405902988"
## [1] "Without 2020 Mean Squared Error: 67.7703432164646"
## [1] "Cross-Validation Mean Absolute Value Error (Without 2020): 3.49227460338454"
Above are some in-sample and out-of-sample ways to evaluate the strength of GDP Growth model. Across the board, the model performs pretty poorly, as we see very low R-Squared values, high Mean Squared Errors and Cross-Validation Mean Absolute Value Errors with vote margin percentages large enough to sway a close election. The GDP model that leaves out 2020 generally fares better, but it is still not great.
## [1] "2024 GDP-Predicted Incumbent Vote Margin: 4.15855909921272"
## [1] "2024 GDP-Predicted Incumbent Vote Margin (Excluding 2020 from Model): 3.21368743265838"
Even still, we can predict how the incumbent party will perform given GDP growth as the input. Across models that involve 2020 and exclude it, it seems that Harris will have a fairly large lead in national popular vote share against Trump. We will tally these outcomes, although flawed in terms of strength of model, as we go along.
Harris +1
CPI and Vote Margin #
## Warning: The following aesthetics were dropped during statistical transformation: label.
## ℹ This can happen when ggplot fails to infer the correct grouping structure in
##   the data.
## ℹ Did you forget to specify a `group` aesthetic or to convert a numerical
##   variable into a factor?
## Warning: The following aesthetics were dropped during statistical transformation: label.
## ℹ This can happen when ggplot fails to infer the correct grouping structure in
##   the data.
## ℹ Did you forget to specify a `group` aesthetic or to convert a numerical
##   variable into a factor?
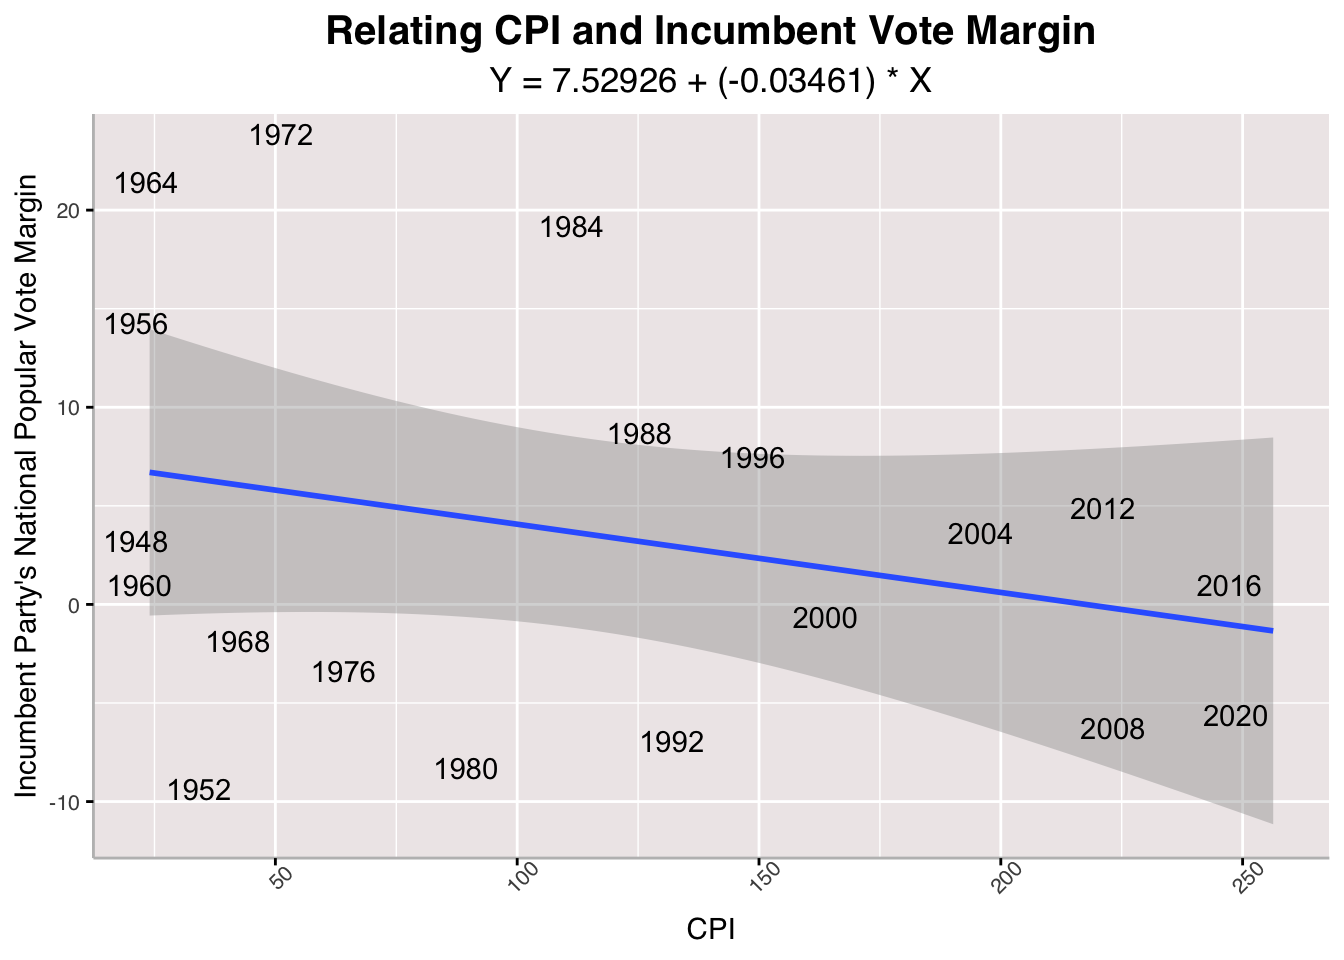
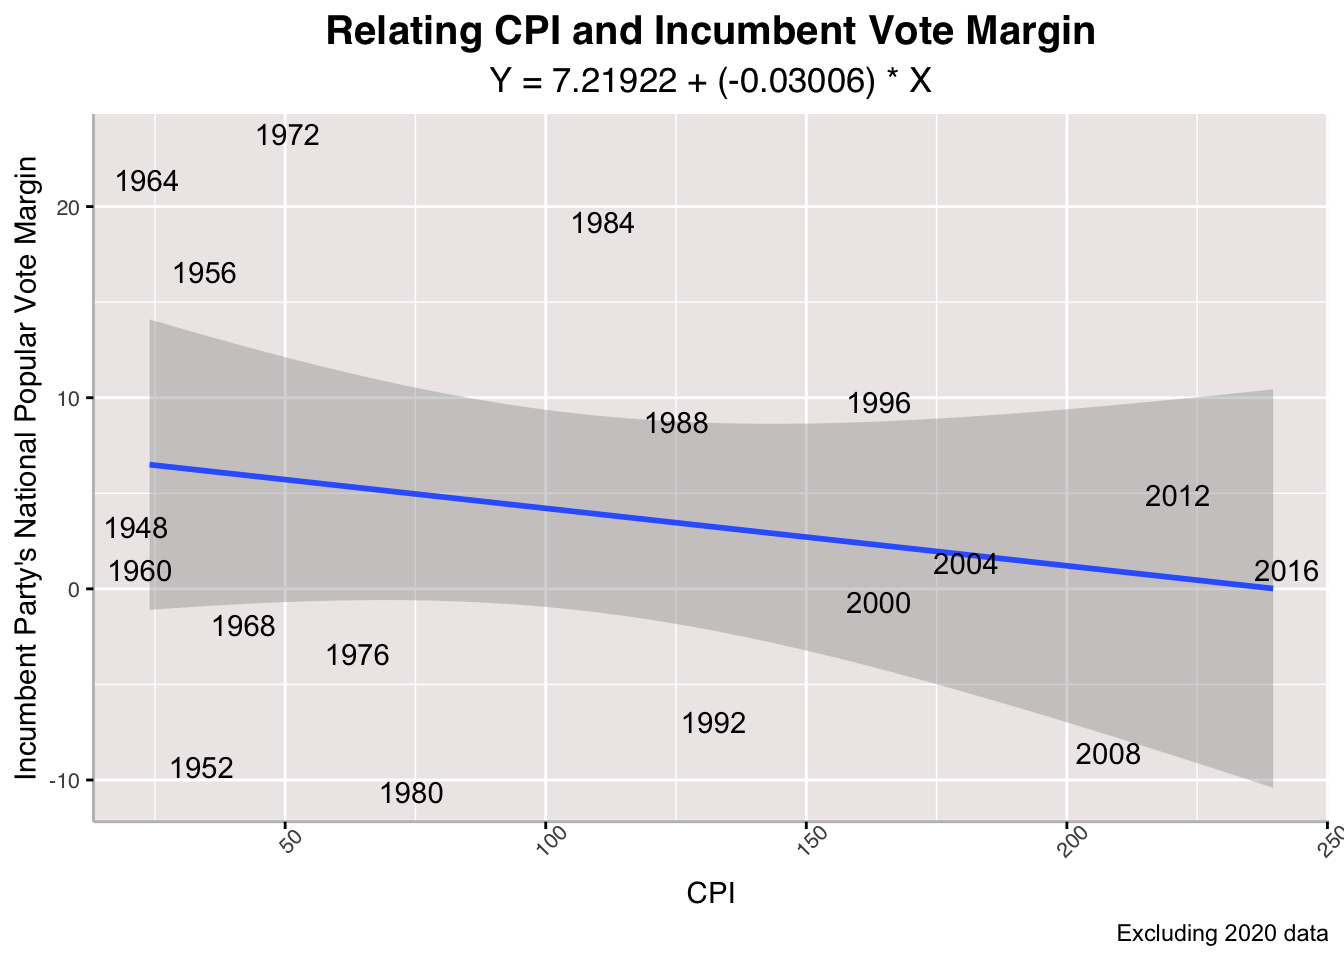 Above, I run a linear regression on the relationship between between Consumer Price Index and Incumbent Vote Margin. This is a critical measure because voters are exposed to sticker shock effects as a result of inflation and can vote accordingly. It might be a national measure, but individual voters are directly exposed to it. According to the model, there is a pretty strong negative relationship between CPI and incumbent vote margin, suggesting that the higher that consumer prices are, the worse an incumbent party's performance in the upcoming presidential election. Here, it seems that 2020 actually does not distort the model's relationship of the two variables.
## [1] "With 2020 R-Squared: 0.0801668996456767"
## [1] "Without 2020 R-Squared: 0.0520097549971837"

## [1] "With 2020 Mean Squared Error: 89.8022407816482"
## [1] "Without 2020 Mean Squared Error: 94.1040653199678"
## [1] "Cross-Validation Mean Absolute Value Error (Without 2020): 4.10555052900707"
The CPI model fares even worse than the GDP model with abysmal R-Squared values, high Mean Squared Errors, and a large Cross-Validation Mean Absolute Value Error.
## [1] "2024 CPI-Predicted Incumbent Vote Margin: -3.30839041076806"
## [1] "2024 CPI-Predicted Incumbent Vote Margin (Excluding 2020 from Model): -2.19490995507331"
Building our linear regression model on solely the CPI, we see that Harris trails Trump by 3.3% share of national popular vote with 2020 data and 2.2% excluding it. This makes sense as voters have consistently aired their grievances about inflation through this campaign season.
Trump +1
RDPI Growth and Vote Margin #
## Warning: The following aesthetics were dropped during statistical transformation: label.
## ℹ This can happen when ggplot fails to infer the correct grouping structure in
##   the data.
## ℹ Did you forget to specify a `group` aesthetic or to convert a numerical
##   variable into a factor?
## Warning: The following aesthetics were dropped during statistical transformation: label.
## ℹ This can happen when ggplot fails to infer the correct grouping structure in
##   the data.
## ℹ Did you forget to specify a `group` aesthetic or to convert a numerical
##   variable into a factor?
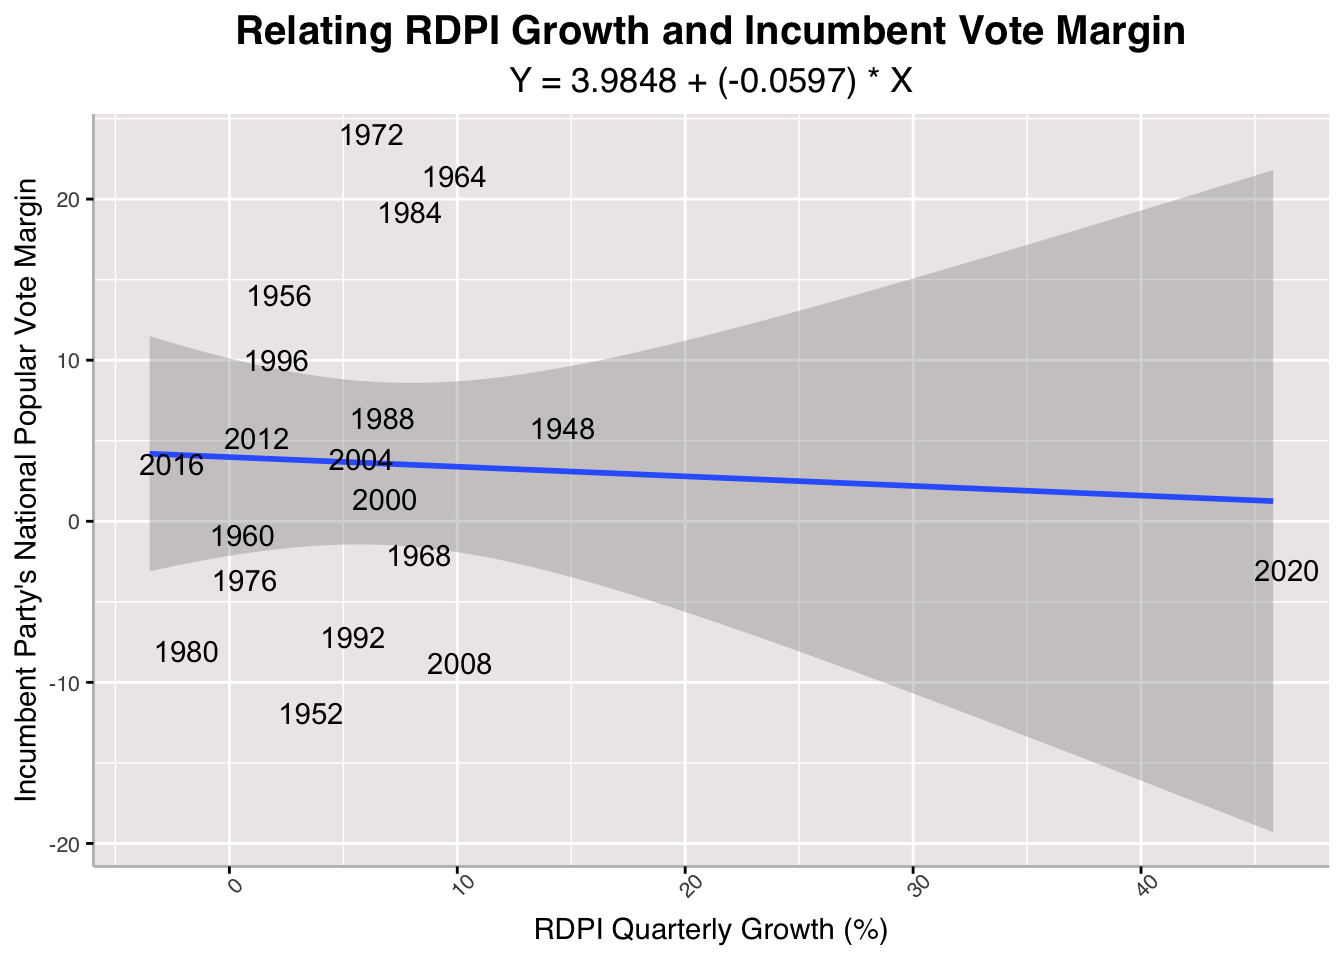
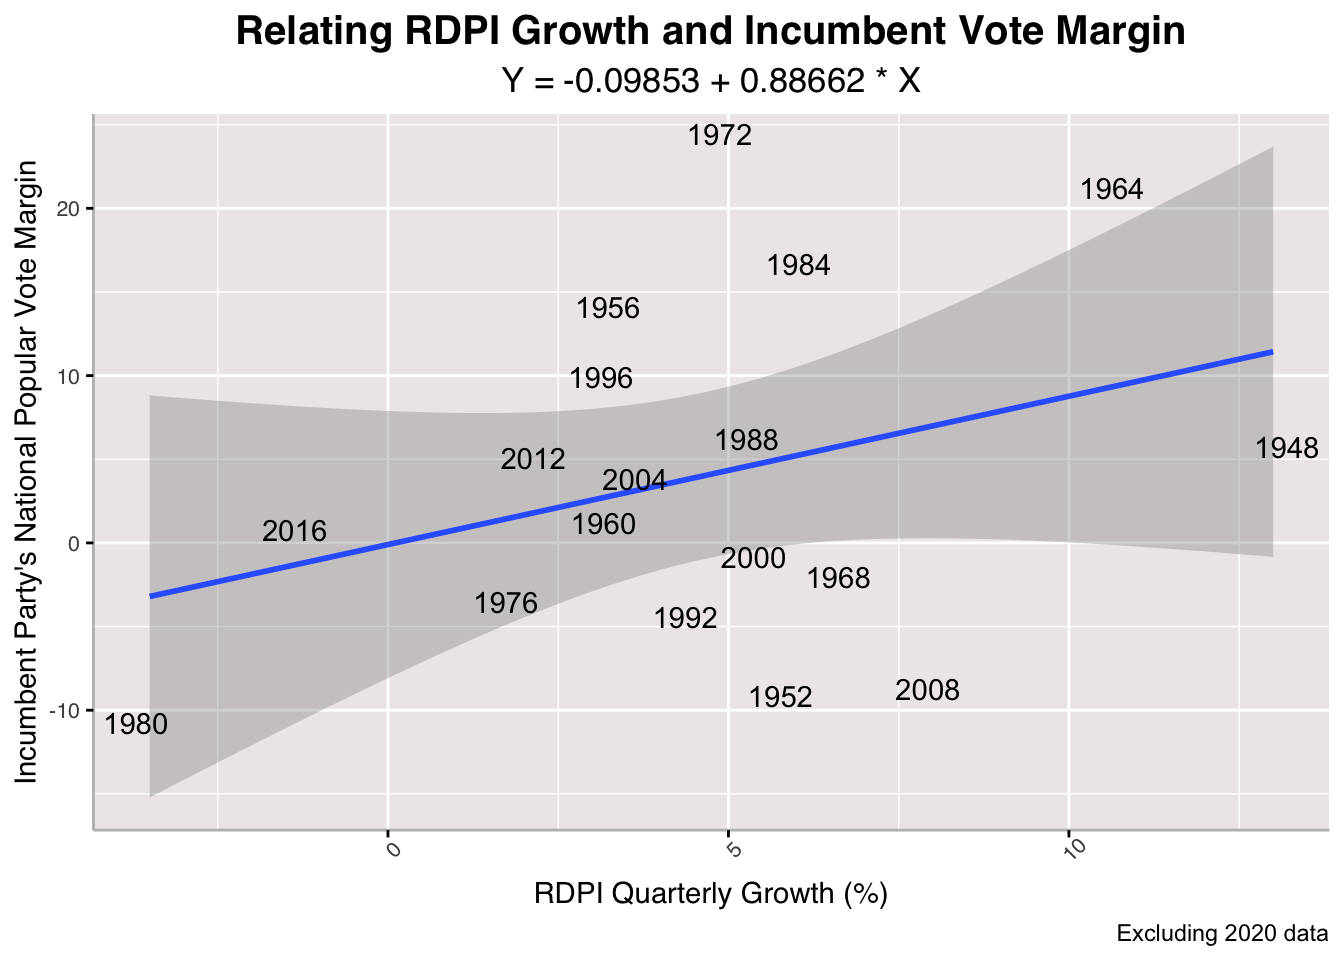 Now, I run a linear regression on the relationship between between Quarterly Growth in Real Disposable Personal Income and Incumbent Vote Margin. RDPI is my proxy for personal finances and can provide insight into how much voters are actually working with after taxes. According to the model, there is a pretty strong positive relationship between RDPI and incumbent vote margin, suggesting that the greater growth in RDPI, the better an incumbent party's performance in the upcoming presidential election. Here, it seems that 2020 completely distorts the model's relationship of the two variables, so it is probably best to leave it out.
## [1] "With 2020 R-Squared: 0.00355888626006062"
## [1] "Without 2020 R-Squared: 0.109188411395232"


## [1] "With 2020 Mean Squared Error: 97.2813924464543"
## [1] "Without 2020 Mean Squared Error: 88.4281166011348"
## [1] "Cross-Validation Mean Absolute Value Error (Without 2020): 4.12420093760933"
Again, the RDPI model performs pretty poorly with in-sample and out-of-sample tests. It yields low R-Squared values even when I leave out 2020 data. The Mean Squared Error is high and so is the Cross-Validation Mean Absolute Value Error.
## [1] "2024 RDPI Growth-Predicted Incumbent Vote Margin: 3.9250814230794"
## [1] "2024 RDPI Growth-Predicted Incumbent Vote Margin (Excluding 2020 from Model): 0.788092792500218"
However, if we use this model to forecast the upcoming election, it appears that Harris will win. The model that involves 2020 data I determined was extremely flawed for distorting the input-outcome relationship. When we exclude 2020 data, it appears that Harris only wins the national popular vote share by less than a percentage, signaling a close race (if Quarterly RDPI Growth is all that mattered to voters).
Harris +1
Unemployment and Vote Margin #
## Warning: The following aesthetics were dropped during statistical transformation: label.
## ℹ This can happen when ggplot fails to infer the correct grouping structure in
##   the data.
## ℹ Did you forget to specify a `group` aesthetic or to convert a numerical
##   variable into a factor?
## Warning: The following aesthetics were dropped during statistical transformation: label.
## ℹ This can happen when ggplot fails to infer the correct grouping structure in
##   the data.
## ℹ Did you forget to specify a `group` aesthetic or to convert a numerical
##   variable into a factor?
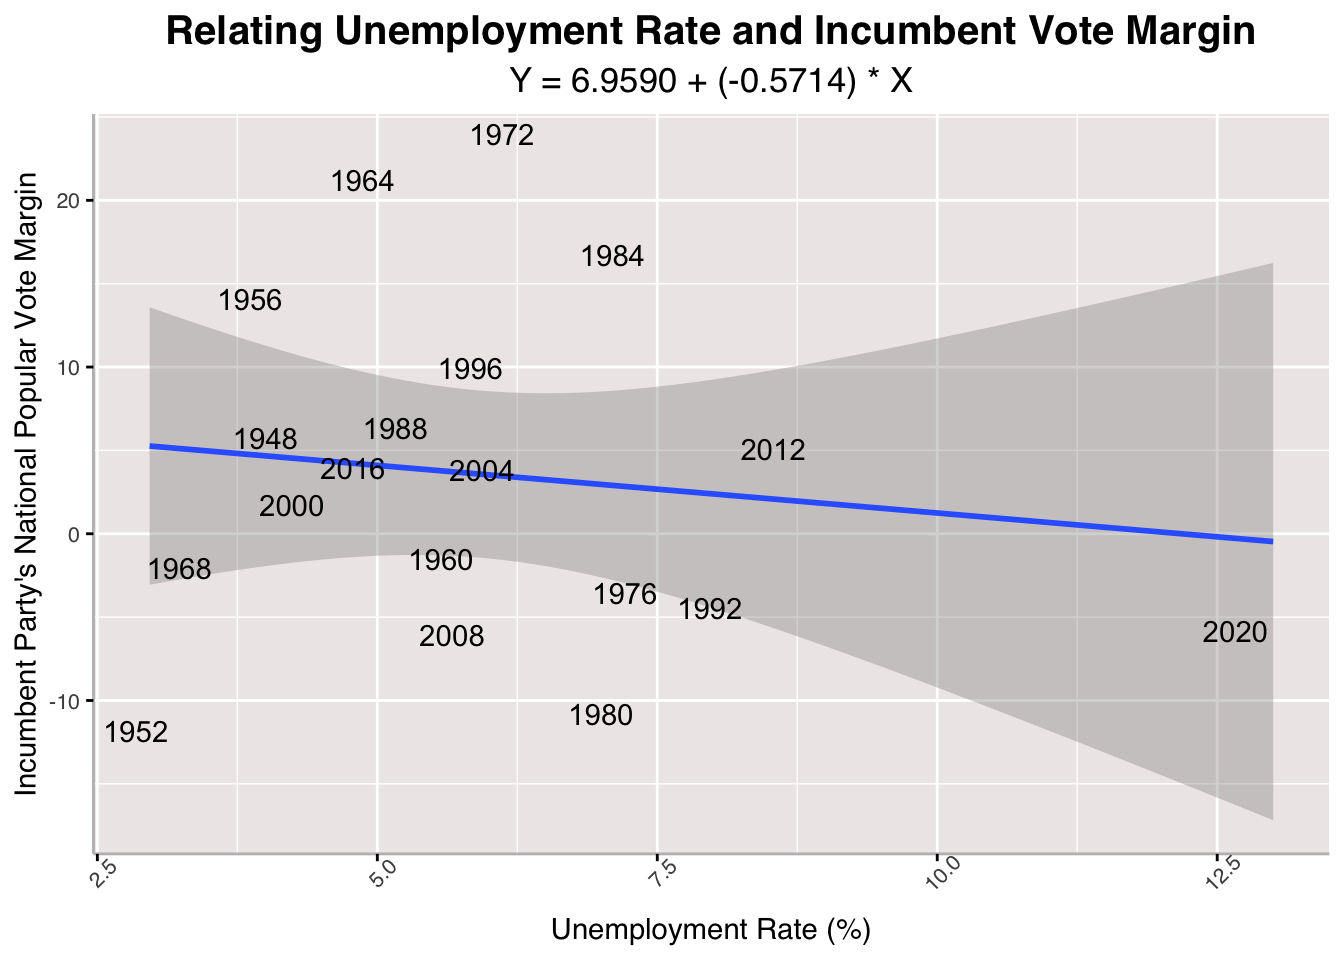
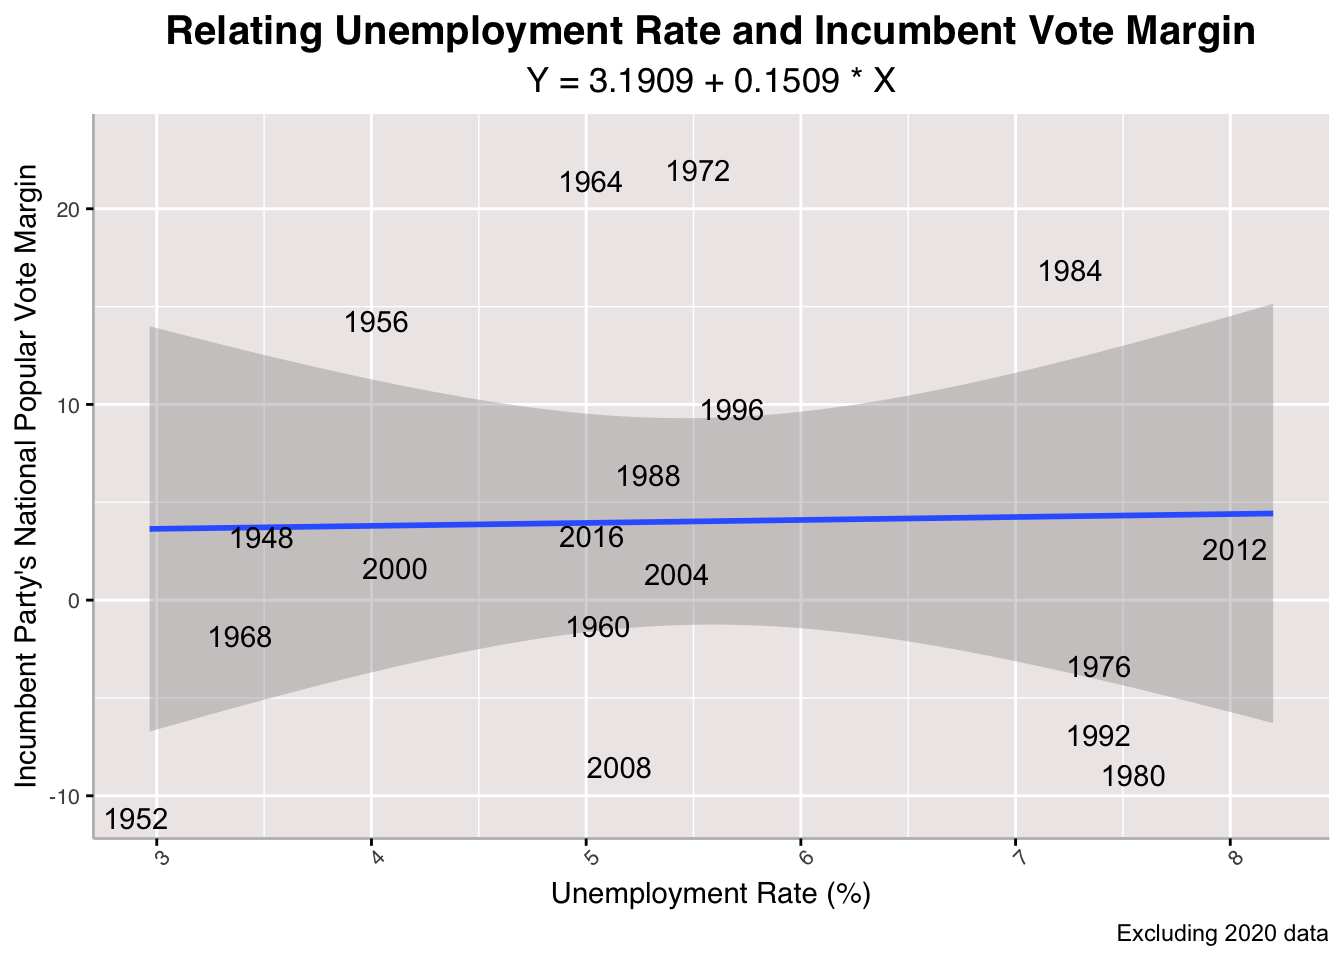 Continuing with the economic phenomena Radcliffe and Skelley highlight as important to voters, I run a linear regression on the relationship between between Unemployment and Incumbent Vote Margin. Interestingly, the model suggests that there is no correlation between unemployment and incumbent vote margin, especially if we look at the one that excludes 2020 data. It makes sense to exclude 2020 here because it forces a relationship that looks like does not exist.
## [1] "With 2020 R-Squared: 0.0165836375771564"
## [1] "Without 2020 R-Squared: 0.00052581496233859"

## [1] "With 2020 Mean Squared Error: 96.0098010529196"
## [1] "Without 2020 Mean Squared Error: 99.2147171241475"
## [1] "Cross-Validation Mean Absolute Value Error (Without 2020): 4.45637576555212"
The R-Squared values for the unemployment-predicted model are the lowest we have seen so far. THe Mean Squared Errors are also the highest and the Cross-Validation Mean Absolute Value Error is a large percentage vote margin that could push an election in any direction.
## [1] "2024 Unemployment-Predicted Incumbent Vote Margin: 4.67350537665337"
## [1] "2024 Unemployment-Predicted Incumbent Vote Margin (Excluding 2020 from Model): 3.79434427081865"
The model suggests that the incumbent party, Harris and the Democrats, will win the national popular vote share in November—whether we include 2020 data or not.
Harris +1
Stock Market Performance and Vote Margin #
## Warning: The following aesthetics were dropped during statistical transformation: label.
## ℹ This can happen when ggplot fails to infer the correct grouping structure in
##   the data.
## ℹ Did you forget to specify a `group` aesthetic or to convert a numerical
##   variable into a factor?
## Warning: The following aesthetics were dropped during statistical transformation: label.
## ℹ This can happen when ggplot fails to infer the correct grouping structure in
##   the data.
## ℹ Did you forget to specify a `group` aesthetic or to convert a numerical
##   variable into a factor?
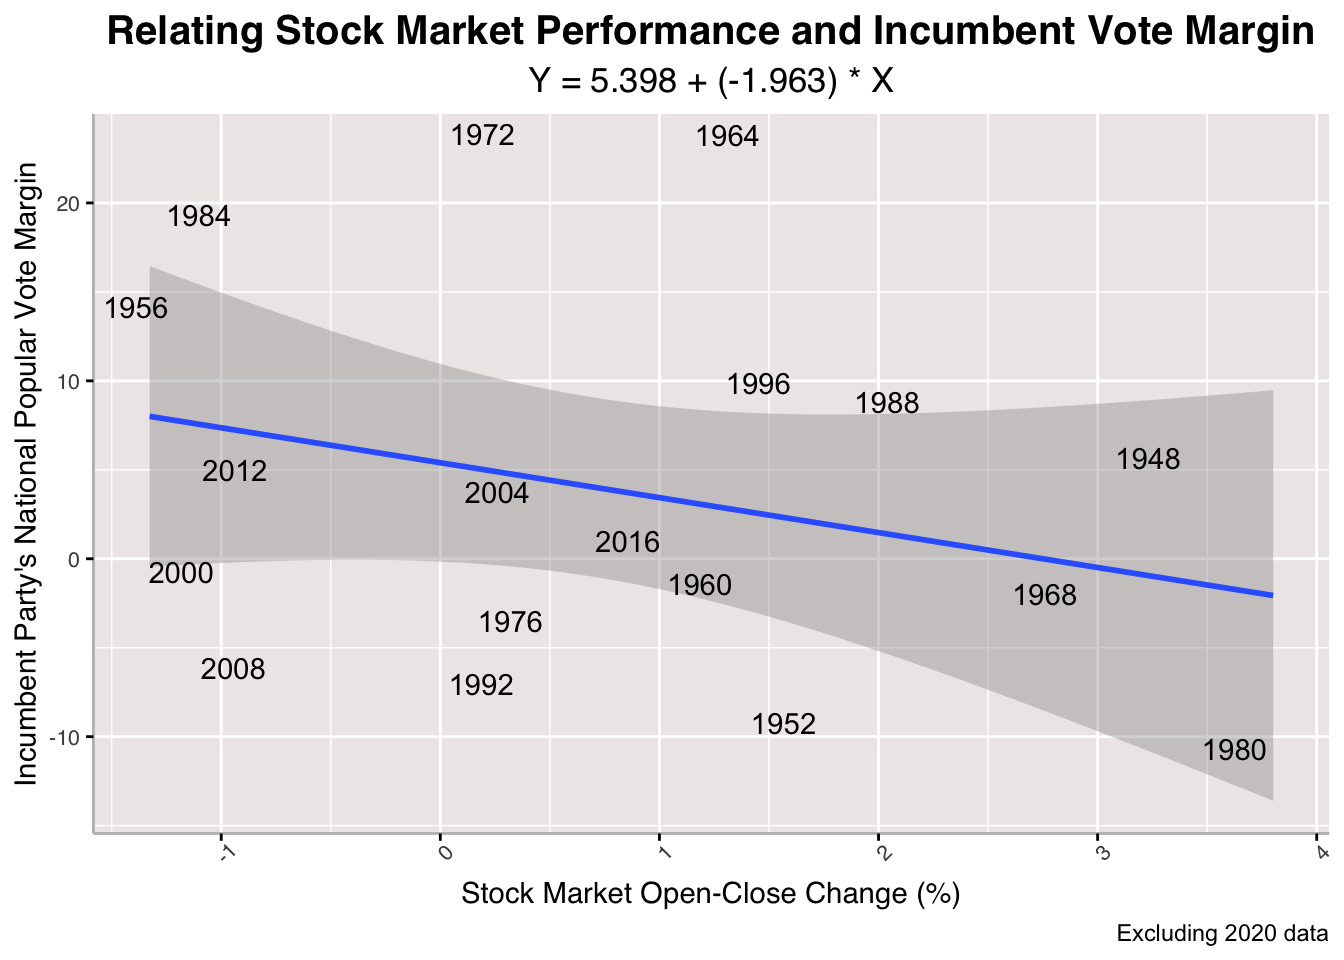
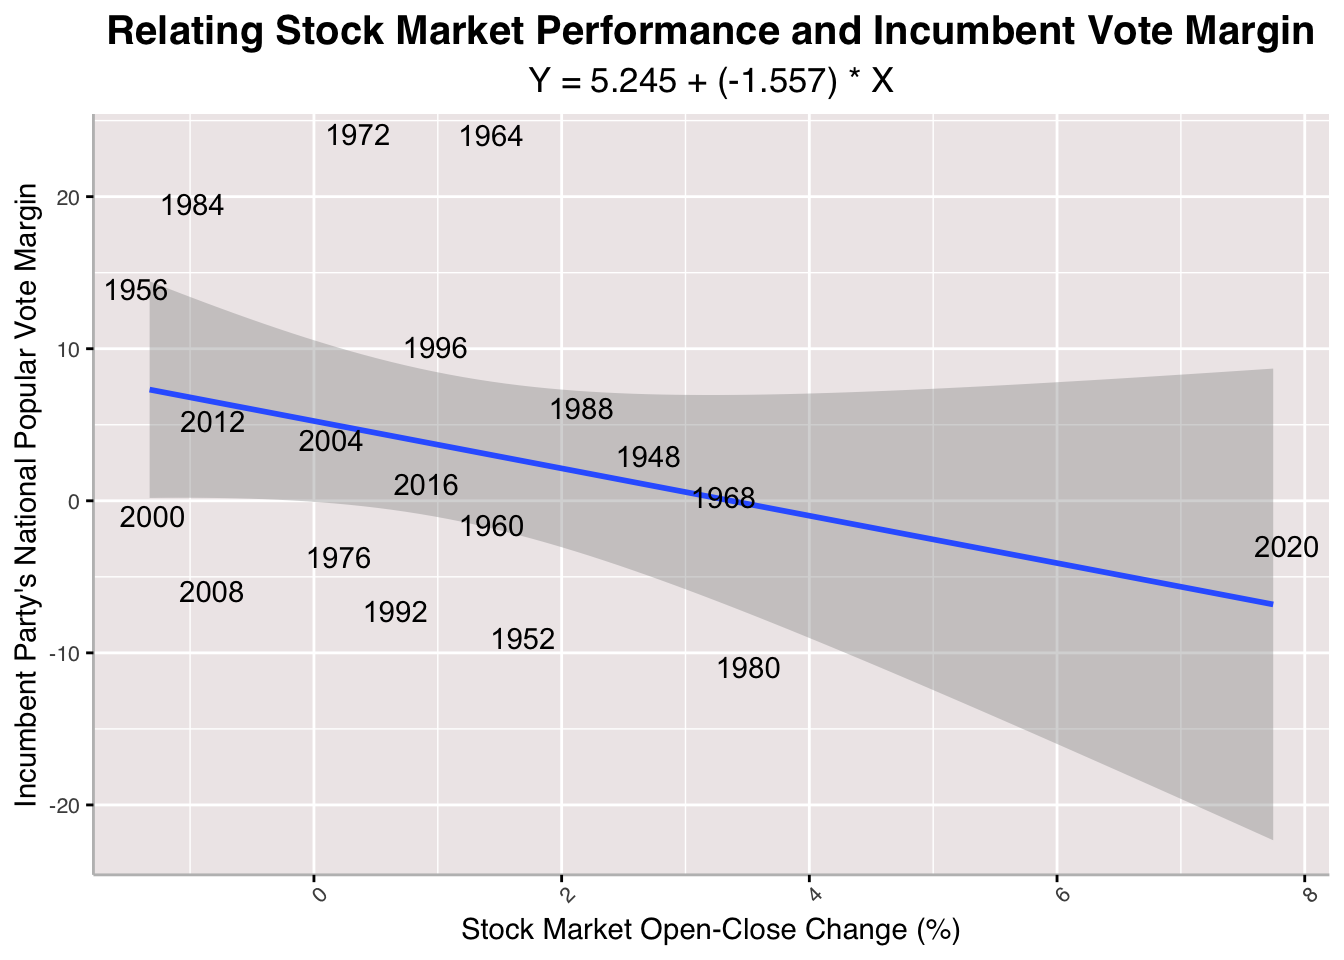
Finally, we look to stock market performance as a metric of economic success that voters find salient. Both 2020-inclusive and 2020-exclusive models suggest a negative relationship between Stock Market Change and Incumbent Vote Margin. This is counter-intuitive because it suggests that greater growth of the SP500 coincides with poorer performance of the incumbent party in an upcoming election. It might be that higher percentage stock market changes actually signal a volatile economy that voters fear; this is speculative though and not an actual attempt to establish causality. If this were the case, it would not be wise to use a linear model and to use a more complex one instead.
## [1] "With 2020 R-Squared: 0.114865484041972"
## [1] "Without 2020 R-Squared: 0.0881691133665322"
## [1] "With 2020 Mean Squared Error: 86.4146581543887"
## [1] "Without 2020 Mean Squared Error: 90.5146374330731"
## [1] "Cross-Validation Mean Absolute Value Error (Without 2020): 4.04551477075529"
Like the rest, the stock market model performs poorly in measures of in-sample and out-of-sample testing. The R-Squared values are low, the Mean Square Errors are high, and the Cross-Validation Mean Absolute Value is a large percentage value.
## [1] "2024 Stock Market-Predicted Incumbent Vote Margin: 3.99855641825043"
## [1] "2024 Stock Market--Predicted Incumbent Vote Margin (Excluding 2020 from Model): 3.8267002013802"
When we predict incumbent vote margin using this model, we get that Harris will be ahead of Trump by about 4 points with regards to the national popular vote share.
Harris +1
Conclusion #
Harris: 4
Trump: 1
Prediction: Harris will win the popular vote in November.
If we treat each metric of the economy (that I used to run these regressions) as keys, we see that Harris has won four economic keys and Trump has won just one. This deviates from Skelley’s suggestion that retrospective voters will disfavor Harris in light of their economic grievances.
In all honesty, these models are quite bad. I would not put my money on the prediction resultant from them. The best model by in-sample and out-of-sample metrics was the Quarterly-GDP-Growth-Predicted Model, which itself was pretty poor. The absolute worst model overall was the Quarterly-RDPI-Growth Predicted Model. I suspect that these models are not robust because there are only 18 or 19 (when including 2020) observations of election years off of which I am working. It is a pretty small sample size and difficult to draw statistically significant insights from. This reflects a challenge with using economic data to forecast elections—there are only so many elections to draw data from and to use to train models, resulting in a lot of variance as we see with my linear regression models. Across all models, I had errors that could have totally changed the outcome of who wins the popular vote. How can we base a forecast on models that themselves cannot make a real prediction?
In future economic models, I hope to use more granular data (month-wise or quarter-wise) and involve polling data to track how opinions change along with measures of economic performance. This time, I only used bivariate linear regressions, but I will in the future include multiple independent variables and weigh them by polls of voters and how salient they are.
Sources #
“Presidential Debates Do Matter | 538 Politics Podcast.” YouTube, uploaded by FiveThirtyEight, 9 Sept. 2024, www.youtube.com/watch?v=PkjfKF0frvs.
Data Provided by GOV 1347: Election Analytics teaching staff (which itself drew from the Burueau of Economic Analysia and Federal Reserve Economic Data)