Week 3: Polling #
Monday, September 23, 2024
42 Days until Presidential Election
Hi again! Since last week, the Harris and Trump campaigns have been campaigning aggressively in battleground states. Realistically, who the next president will be hinges on voters in these key states: some have called this the closest presidential race of the past six decades. I touched briefly on the Harris-Trump debate last week, and although the Harris campaign agreed to another, Trump refuses to debate while voters in some states are beginning to cast their ballots. The VP candidates, however, are scheduled to debate each other next week on October 1st. This week, early voting begins in Minnesota, South Dakota, and Virginia. Considering how thin the margins between Harris and Trump are, it is important to consistently track their performance through polling data. Involving polling data into my model is the focus of this week. Because this race is unique in the fact that Harris entered with less than 16 weeks until election day, the scope of our forecasting is much more limited in available polling data than previous election years.
Individual Poll Ratings #

In the charts above, I visualize the distribution of ratings of individual polls I use for the 2016, 2020, and 2024 election years. This data was provided by Matthew Dardet, who initially sourced it from FiveThirtyEight’s public GitHub. FiveThirtyEight, a poll aggregator, assigns grade values to individual polls, which we can use a proxy to interpret how much trust to put into their numbers. You might notice that the scale evolves from an A-D grading scaling, to A-F with “on-the-fence” assignments as well (e.g. “A/B”), to a continuous numeric scale from 0-3.0. For the sake of comparison, I’ve stacked these plots to understand how the distribution of polling quality varies from election year to election year. It seems that there exists—as a whole—a pretty even spread of poll ratings, with convergence on A, B, C grades (or 3, 2, 1 grades). In 2020, however, there seem to be significantly more polls with a C rating. There are also a good amount of polls that have not been assigned grades (NA values). In its forecasting, FiveThirtyEight weights poll data by its rating, so as not to give the same importance to the numbers of a fail-grade poll as an exceptional one.
2016 Polling Averages #

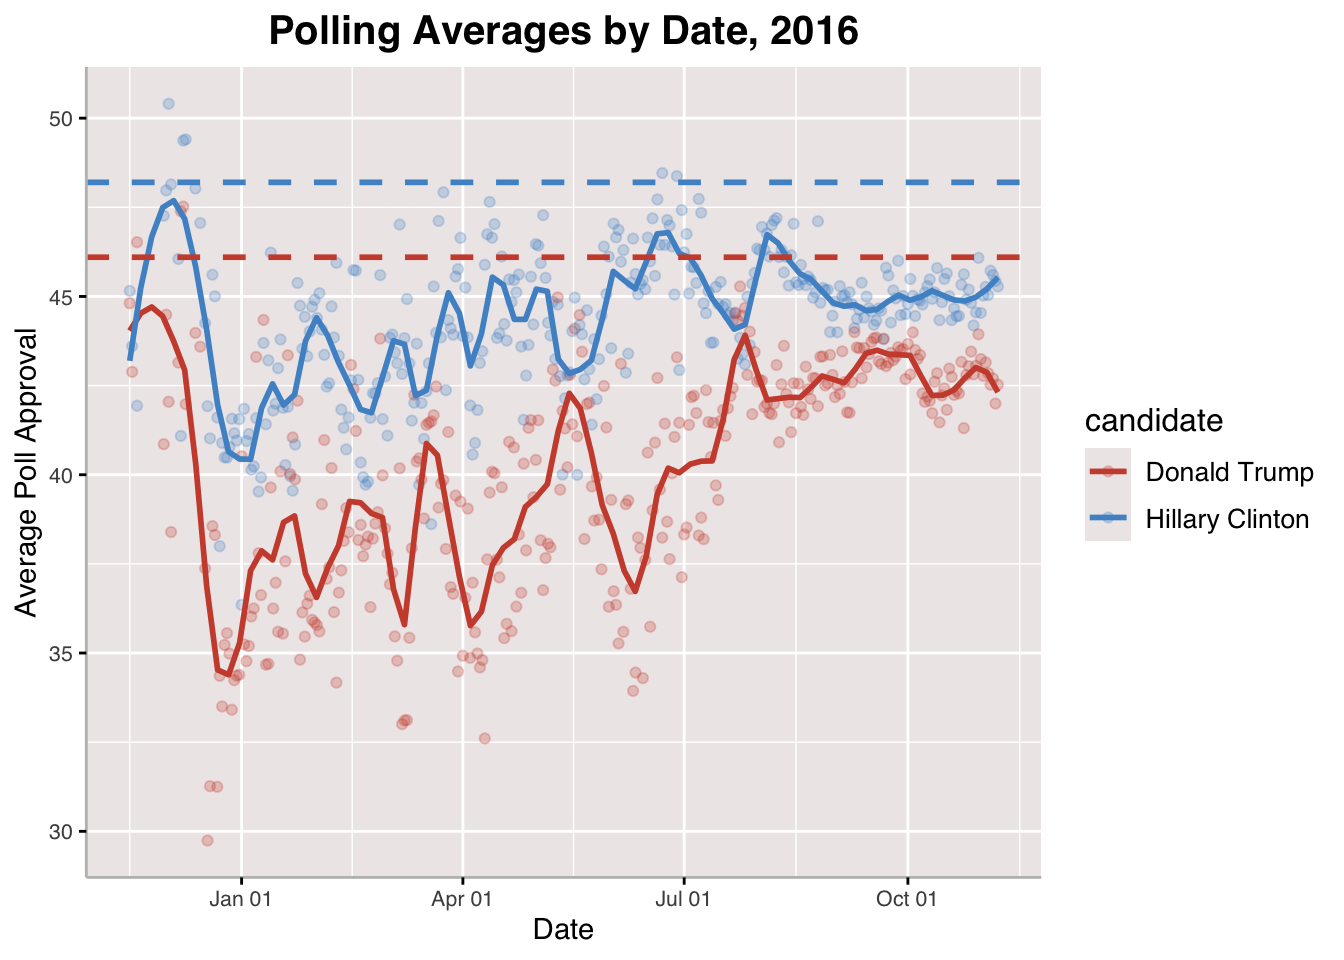
To set up this plot, I averaged individual polls across the same day for the year leading up to the 2016 election. The polling numbers are interesting here because for the first few months it appears that, as Clinton went up in approval, so did Trump—same with when her numbers fell. This is not intuitive because, one would assume, that when a Democratic candidate does well a Republican candidate’s approval drops (and vice versa). It is important to note, however, this is before both parties’ primaries even began. After February 1, 2016 when primaries began, Clinton’s gains coincide with Trump’s losses and Trump’s gains with Clinton’s losses. I hypothesize that this is because a frontrunner emerges within each party and voters begin to seriously compare top candidates across parties, resulting in inverse effects between them. The Clinton-Trump polling margin ranged from over 10 points to less than one 1 point. Clinton seemed to maintain the lead throughout the race however, which is in line with her eventually winning the popular vote in November. The dashed line represents each candidate’s actual vote share in the election; as a whole, these polls underestimated the popular vote share of both candidates.
2020 Polling Averages #

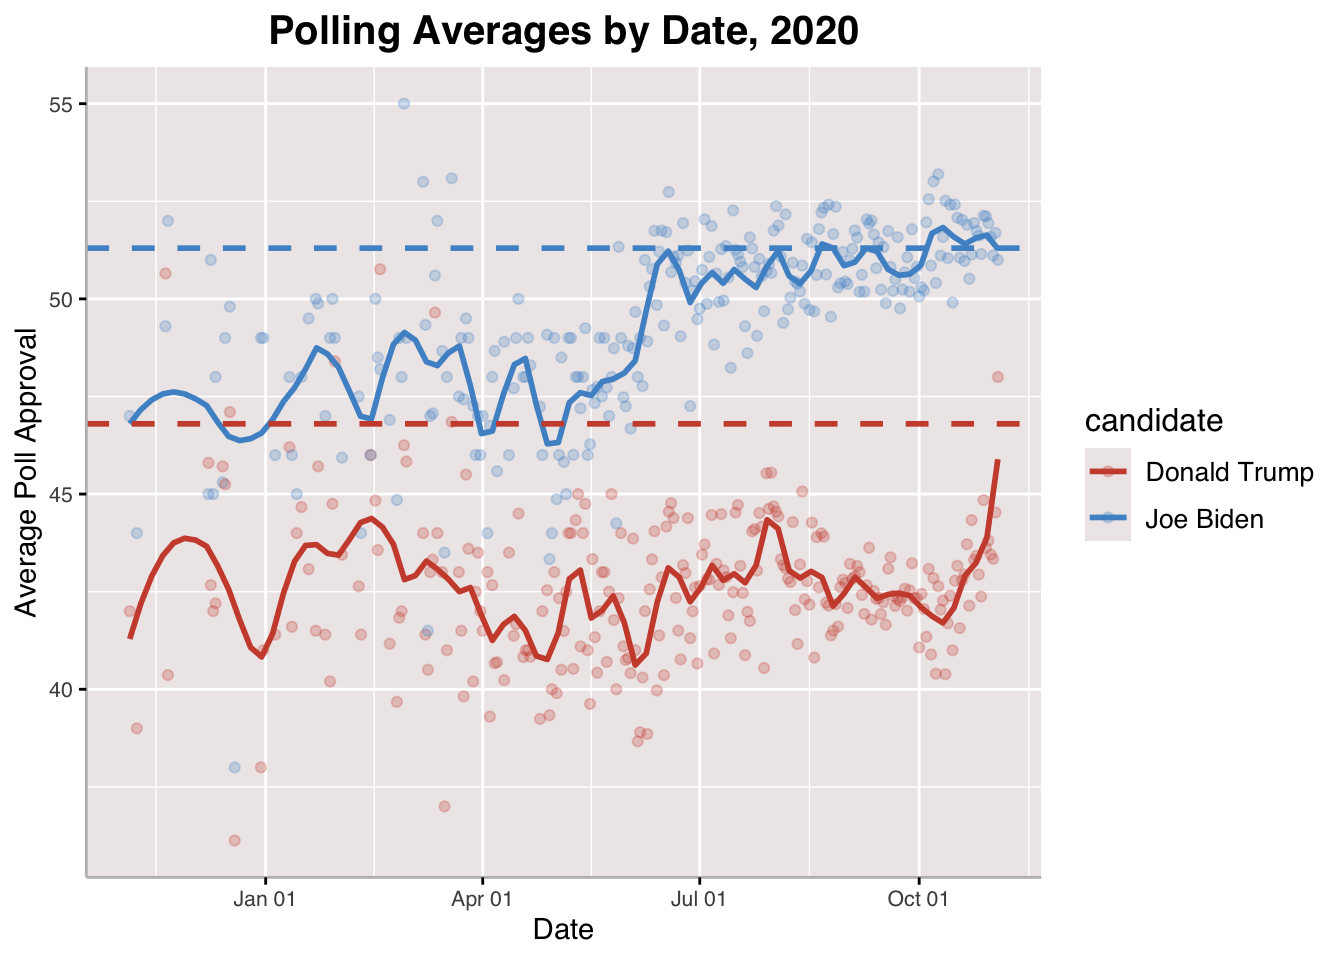
I set up this plot the same way I did for 2016, by taking day averages. The party primaries in 2020 began on February 3rd. We see the same phenomenon we did in 2016, where before that point the approval of both candidates seems to line up with the same ups and downs. After February 3rd, however, the main candidates emerge and begin to diverge: when Trump did well, Biden did poorly and when Biden did well, Trump did poorly. Especially in comparison to 2016, the final polls were remarkably close to predicting the actual vote share of each candidate. For Biden, it is virtually the same, and for Trump, just a point or two short.
2024 Polling Averages #

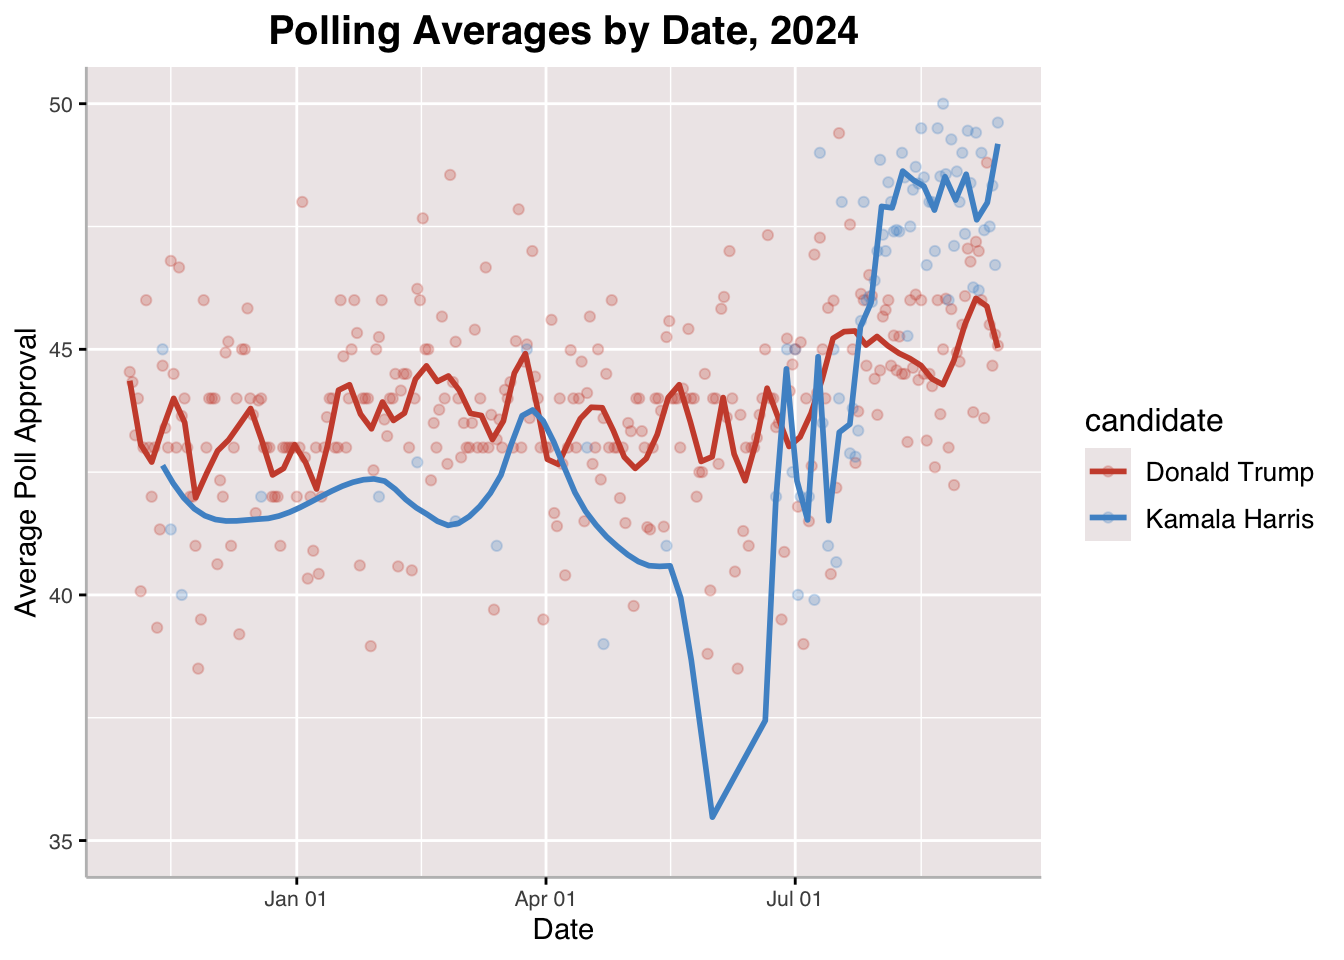
For this plot, I calculated and plotted day averages just like I did for 2016 and 2024. You might notice that you see much less polling data for Harris (blue dots) until about July. This is because Biden was the assumed Democratic candidate who would face off against Trump for the majority of the election cycle. The polls that collected data on Harris were likely operating under a hypothetical and testing how various alternates would fare against Trump. After Biden dropped out and that became a reality, more polling data on Harris as president was collected.
Regularized Regression Using Individual Polls #
##
## November Polling Average OLS Regressions
## =============================================================
##                                Dependent variable:
##                     -----------------------------------------
##                                        pv
##                                        OLS
##                     Democratic Candidates    Party-Stacked
##                              (1)                  (2)
## -------------------------------------------------------------
## nov_poll                    0.745               0.681*
##                                                 (0.209)
##
## Constant                   13.340               15.733
##                                                 (9.775)
##
## -------------------------------------------------------------
## Observations                  2                    4
## R2                          1.000                0.842
## Adjusted R2                                      0.763
## Residual Std. Error                         1.314 (df = 2)
## F Statistic                               10.635* (df = 1; 2)
## =============================================================
## Note:                             *p<0.1; **p<0.05; ***p<0.01
##
## Comparison of OLS and Regularized Regression Methods
## ==============================================
##                        Dependent variable:
##                    ---------------------------
##                               pv ~
##                                OLS
## ----------------------------------------------
## poll_weeks_left_7            -3.488
##
##
## poll_weeks_left_8             5.957
##
##
## poll_weeks_left_9            -1.465
##
##
## poll_weeks_left_10
##
##
## poll_weeks_left_11
##
##
## poll_weeks_left_12
##
##
## poll_weeks_left_13
##
##
## poll_weeks_left_14
##
##
## poll_weeks_left_15
##
##
## poll_weeks_left_16
##
##
## Constant                      1.984
##
##
## ----------------------------------------------
## Observations                    4
## R2                            1.000
## ==============================================
## Note:              *p<0.1; **p<0.05; ***p<0.01

## 11 x 1 sparse Matrix of class "dgCMatrix"
##                             s1
## (Intercept)        32.11771129
## poll_weeks_left_7   0.03034872
## poll_weeks_left_8   0.03382783
## poll_weeks_left_9   0.03150732
## poll_weeks_left_10  0.03251707
## poll_weeks_left_11  0.03591400
## poll_weeks_left_12  0.03424576
## poll_weeks_left_13  0.03573401
## poll_weeks_left_14  0.03675323
## poll_weeks_left_15  0.03401006
## poll_weeks_left_16  0.03482219

## 11 x 1 sparse Matrix of class "dgCMatrix"
##                            s1
## (Intercept)        16.5080023
## poll_weeks_left_7   .
## poll_weeks_left_8   .
## poll_weeks_left_9   .
## poll_weeks_left_10  .
## poll_weeks_left_11  .
## poll_weeks_left_12  .
## poll_weeks_left_13  0.5079695
## poll_weeks_left_14  .
## poll_weeks_left_15  0.1674345
## poll_weeks_left_16  .

## [1] 1.676314
## [1] 0.3259247
## [1] 0.5028851

Table: Table 1: 2024 National Popular Vote Prediction – Individual Polls
| s1 | |
|---|---|
| Harris | 47.96284 |
| Trump | 47.31766 |
The above charts are bit technical, but their purpose is to visualize the regularization of my regression that uses individual polls from 2016 and 2020 to predict the outcome of the 2024 election. I essentially train a model on polling data from 2016 and 2020, subsetting to the period of 16 weeks to 7 weeks out from election day because accurate polls for Harris’s campaign are only available for this time. I, then, test on the Harris-Trump polling data in this period and predict the outcome. I rely on an elastic net model that would minimize multi-collinearity and increase robustness. Though LASSO and Ridge regression are also useful models, the elastic net is versatile and flexibile because it incorporates both of those methods as well. It is also much preferable to Ordinary Least Squares (OLS) because OLS is susceptible to overfitting and collinearity.
Based on the visualization, we see that 14 weeks from election day (the week after Harris announced her campaign), 11 weeks from election day (during the DNC), and 8 weeks from election day (during the presidential debate where Harris performed well) the model demonstrates relatively higher coefficients—though a marginal difference as compared to other weeks. My model based on individual polls predicts Harris’s popular vote share at about 47.96% and Trump’s at 47.32%, corroborating predicitions of an incredibly close election. This is a much closer margin than what Dardet predicted with national poll averages from 1968-2024, which had Harris at 51.8% and Trump at 50.7%. We will address later how it is possible that both candidates’ vote shares add up to more than 100%.
Ensemble Models Using Individual Polls #
Table: Table 2: 2024 National Popular Vote Prediction – Elastic-Net, Fundamentals
| s1 | |
|---|---|
| Harris | 50 |
| Trump | 50 |
Table: Table 2: 2024 National Popular Vote Prediction – Elastic-Net Polls and Fundamentals
| s1 | |
|---|---|
| Harris | 50 |
| Trump | 50 |
Table: Table 2: 2024 National Popular Vote Prediction – Unweighted Polls and Fundamentals
| s1 | |
|---|---|
| Harris | 50.16519 |
| Trump | 49.83481 |
Table: Table 2: 2024 National Popular Vote Prediction – Weighted Polls Closer to November (Silver)
| s1 | |
|---|---|
| Harris | 50.28765 |
| Trump | 49.71235 |
Table: Table 2: 2024 National Popular Vote Prediction – Weighted Fundamentals Closer to November (Gelman & King, 1993)
| s1 | |
|---|---|
| Harris | 50.04688 |
| Trump | 49.95312 |
After using 2016 and 2020 individual polls to predict the 2024 popular vote outcome, I decided I also wanted involve a fundamentals model (See: Week 2 Post for more details) and consider models that weight data heavier for weeks closer to election day. There are five new models, which I construct.
A Fundamentals Only Model using Elastic Net
A Combined Fundamentals and Polling Data Model using Elastic Net
An Unweighted Polling Data and Fundamentals Model
An Closer-To-November-Increasing Weight Polling Data Model (attributable to Nate Silver)
An Closer-To-November-Increasing Weight Fundamentals Model (attributable to Gelman & King, 1993)
Because elastic net predicts linearly and without constraints, I initially had predictions saying that Harris and Trump would get popular vote shares above 60% each. This does not make sense, so I regularized the scales and recalculated such that Harris and Trump were compared against each other and their sums would be 100% to be more informative of how they would actually fare in the election. This would be similar to a two-party vote share. The first two models show that Harris and Trump will tie at 50% vote shares. Once we move to the third Unweighted Polling Data and Fundamentals Model, we find that Harris is predicted to win the two-party popular vote by about .3 points. Mimicing Silver’s model, which assigns higher weights to polls as we move closer to election day, I find that Harris is predicted to win the two-party popular vote by about .6 points. The margins for a Harris win are much slimmer using Gelman & King’s model, which weights fundamentals higher closer to the election at .1.
Conclusion #
Prediction: Based on my individual polls-generated models, Harris will win the popular vote in November by a razor-thin margin.
Across all models I constructed using individual polls from 2016, 2020, and 2024, Harris is predicted to win the popular vote. The models all vary by how much she is predicted to win, but they all find that she will win by an incredibly thin margin. This corroborates the characterization of this race as the closest in decades.
Sources #
Bradner, Eric. “Analysis: The Closest Presidential Race in a Generation.” CNN, 22 Sept. 2024, www.cnn.com/2024/09/22/politics/closest-presidential-race-harris-trump/index.html.Chiacu, Doina. “When and Where Is the Vance-Walz US Vice Presidential Debate?” Reuters, 19 Sept. 2024, www.reuters.com/world/us/when-where-is-vance-walz-us-vice-presidential-debate-2024-09-19/.
Cole, Devan. “Harris and Trump Set for First Debate of Closest Presidential Race in Years.” CNN, 21 Sept. 2024, www.cnn.com/2024/09/21/politics/presidential-debate-harris-trump-cnn/index.html.
“Early In-Person Voting Begins in Three States, Kicking off the Sprint to Election Day.” PBS NewsHour, 22 Sept. 2024, www.pbs.org/newshour/politics/early-in-person-voting-begins-in-three-states-kicking-off-the-sprint-to-election-day.
Polling Data Provided by GOV 1347: Election Analytics teaching staff (which itself drew from the FiveThirtyEight GitHub)
Economic Data Provided by GOV 1347: Election Analytics teaching staff (which itself drew from the Burueau of Economic Analysia and Federal Reserve Economic Data)
Collaborated with Shivali Korgaonkar and Nick Dominguez to construct this model, as part of our week’s presentation on polling.